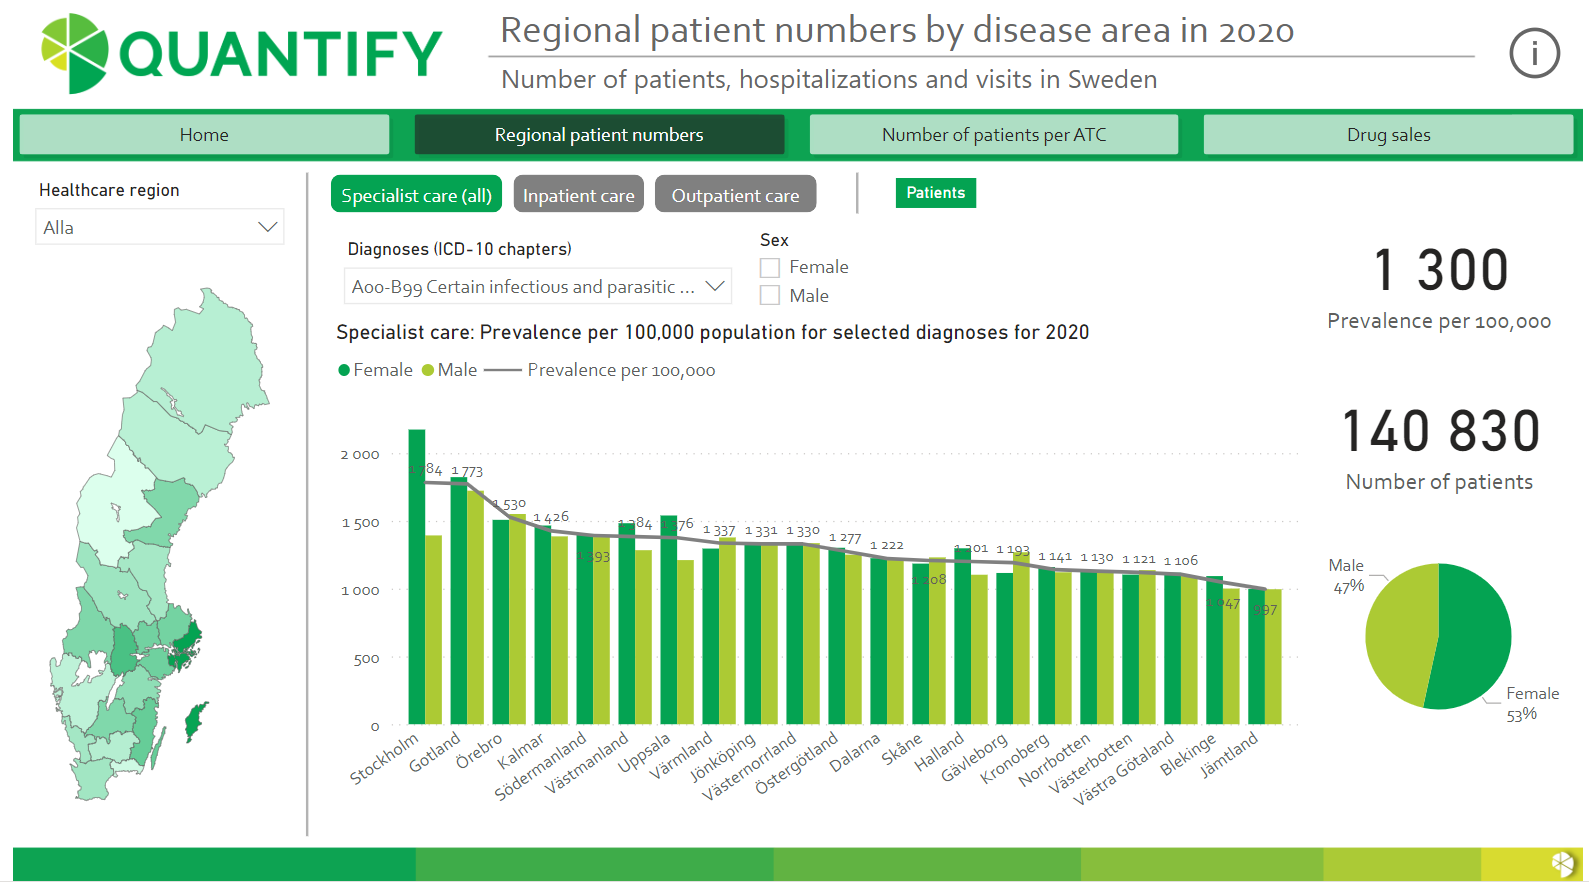
Q-tracker using Power BI
WEB-BASED, INTERACTIVE VISUALIZATION AND ANALYSIS
Power BI allows for interactive visualizations, enabling you to analyze vast amounts of data to access valuable insights with just one click. Power BI offers instant calculations and quick updates when changing to the visualization inputs; visualizations can also be linked directly to PowerPoint to serve as part of a bigger report. Additionally, the program allows for easy updating of the underlying data, making it a great option for reports that need updating on a regular basis.

