Quantify Data Explorer
EPIDEMIOLOGICAL INSIGHTS USING R-SHINY
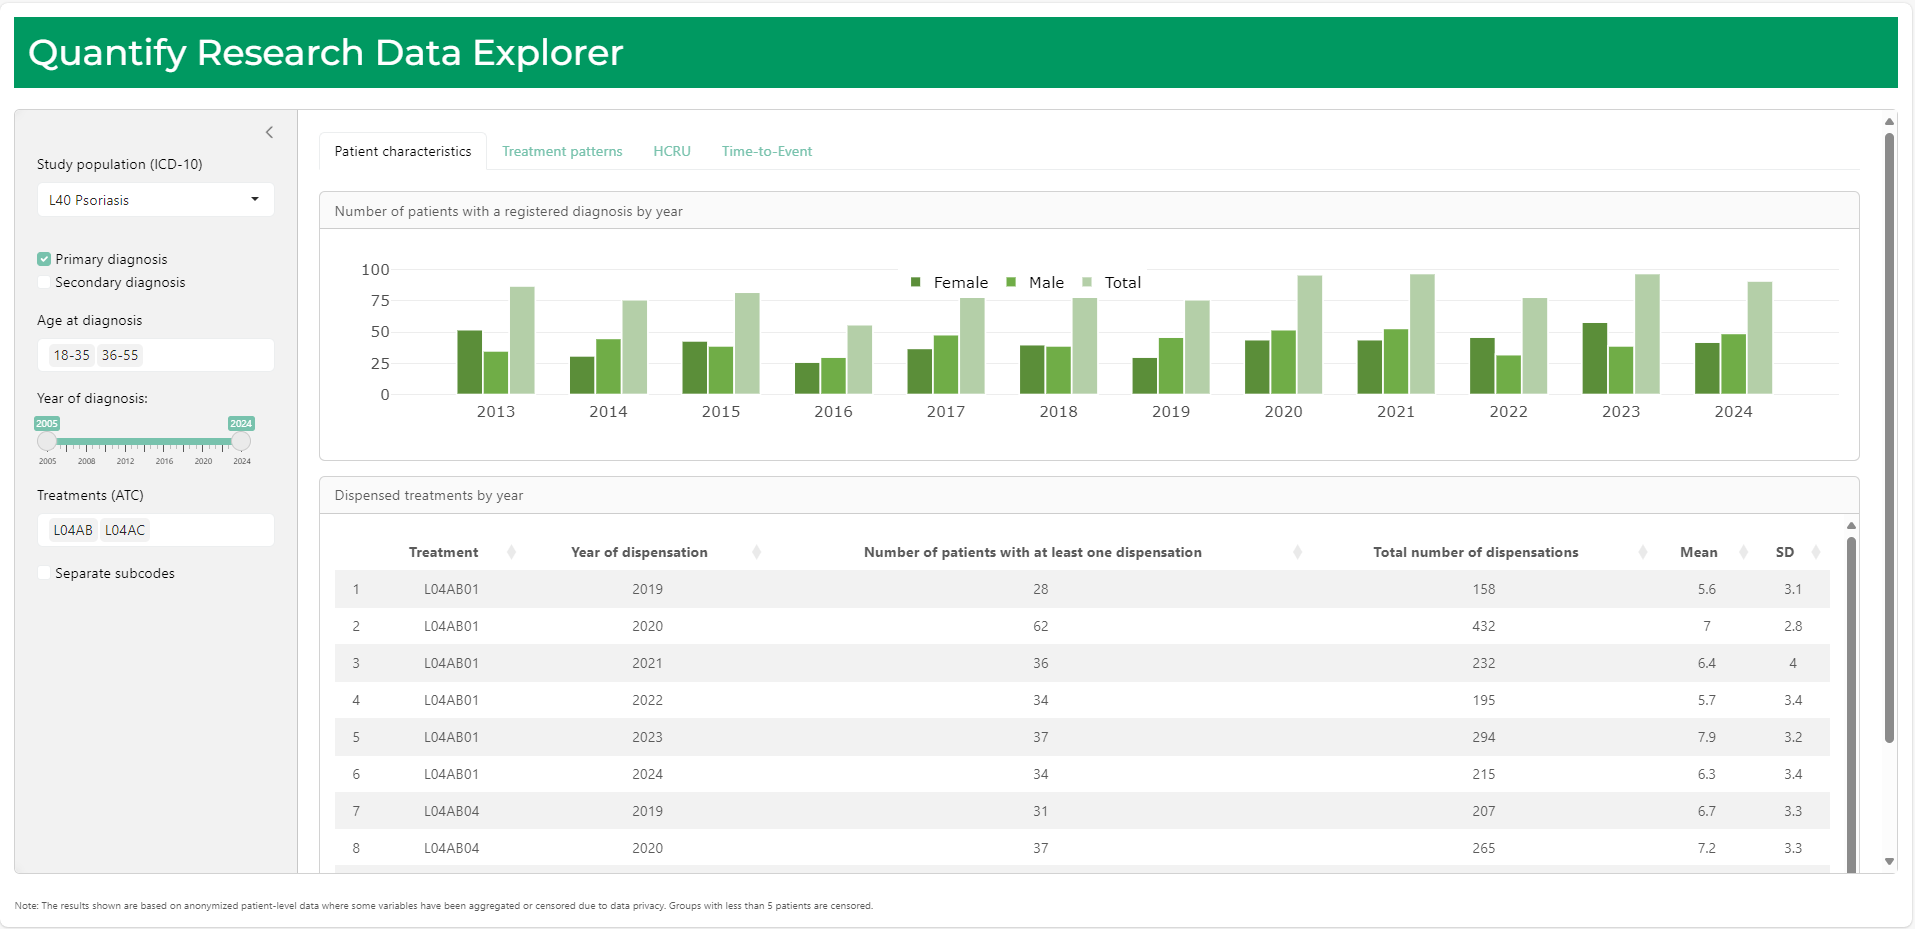
Quantify Data Explorer is a web-based visualization tool designed to let users explore and visualize epidemiological data from the Nordics. Built on the robust R Shiny platform, this web application can leverage comprehensive, anonymized patient-level data from various Nordic registers to provide in-depth insights into several aspects of healthcare.
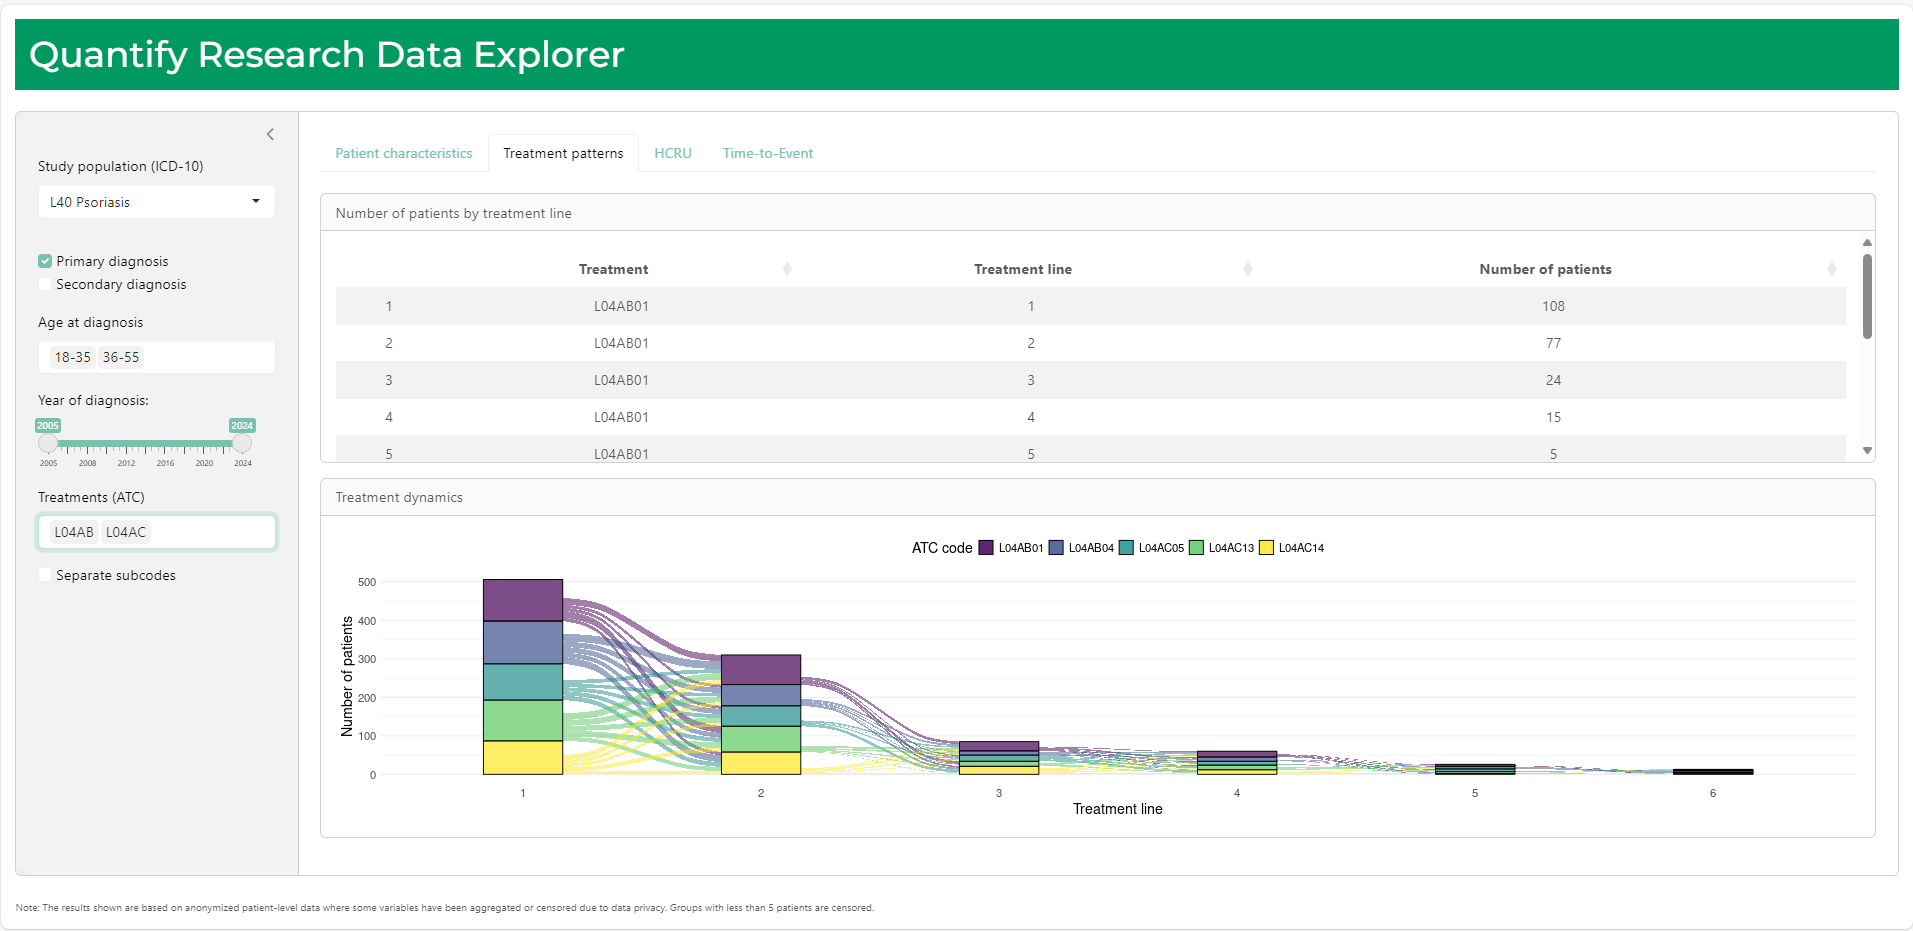
With Quantify Data Explorer, users can delve into detailed analyses of disease epidemiology, pharmacoepidemiology, healthcare resource utilization, and the associated costs of care across multiple indications. The web-app’s enables users to generate compelling visual representations and detailed statistical analyses, facilitating the design and implementation of a full-scale Real Worl Evidence (RWE) study or providing valuable insights on its own for strategic decision-making.
Are you interested to know more about how the Quantify Data Explorer can support your strategic and scientific needs? Please contact Quantify Research at info@quantifyresearch.com.