Turning complex data into valuable insights is crucial. Efficient data visualizations play a key role, revealing compelling stories about historical patterns, current trends, and future opportunities.
In today’s dynamic and data-driven healthcare landscape, there is frequent demand for adaptive analysis tools that include the latest data in each analysis.
At Quantify Research we create interactive dashboards that not only save time but also enhance decision-making, offering a versatile alternative to traditional statistics reports.
Explore our tools:
🔵 Web- based HEOR services with Qfront:
Transform Excel-based tools into user-friendly web applications. Our services include Budget Impact and Cost-Effectiveness models that are accessible and compatible across all devices.
🔵Qtracker for Regional Insights using Power BI:
Delve into Swedish regional data on drug usage, healthcare resource utilization (HCRU), and inpatient care costs. Our interactive Power BI dashboards make comparison and exploration straightforward and insightful.
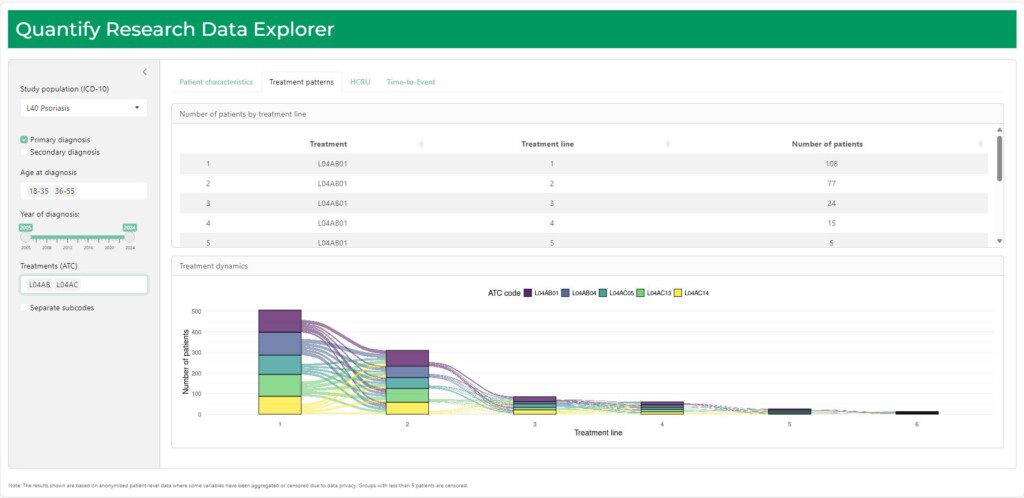
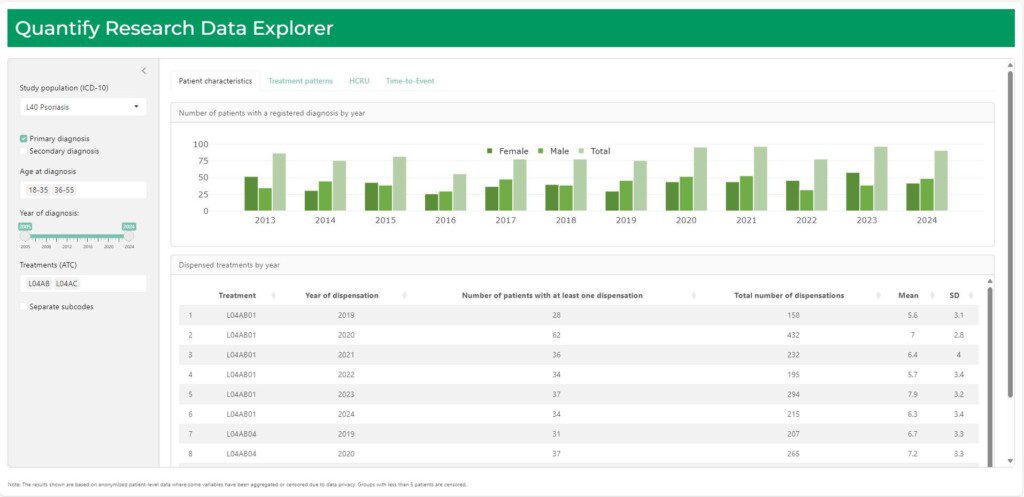
🔵 Quantify Data Explorer for Epidemiological Insights using R-shiny : Discover complex epidemiological patterns and treatment behaviours. Understand your patient groups better with insights into treatment switches, cost of treatment, and time-to-event estimates for treatment persistence. Our tool leverages anonymized patient-level data and advanced analytics in R-Shiny to provide deep insights in an interactive format.
Discover how our tools can transform your data insights.
And see how our tools can be tailored to your needs!